Protect Your Code From Bugs An Overview of Five Static Analyzers for Java Code
In this tutorial we are going to see how developers often need various “assistants” — including static code analyzers which can find and fix flawed code at the early stages of development.
More About Static Analysis
As the IT sphere is actively developing, the amount of written and maintained code grows with an incredible speed. The good old code review is an indispensable assistant that remains popular up to this day. However, the amount of code that reviewers have to look through and think over is horrifying. It takes a great deal of time and effort. Thus, in most cases, reviewers pay attention only to the code fragments critical for program operation.
We should take the load off the reviewers without losing the codebase quality. Static analysis tools come to the rescue. When paired with code review and other methodologies, they enhance each other, thereby maintaining high-level code quality. In fact, a static analysis tool can be considered an automated code review.
The whole point of static analyzers is in receiving the source code/bytecode and giving out the warnings report. First, the source code is converted into AST with semantic information, and various methodologies are applied to it. After all the necessary information is obtained, a static analyzer identifies potential issues.
IntelliJ IDEA Built-In Analyzer
The Java code static analyzer built into IntelliJ IDEA is as good as specialized static analysis tools. The search for suspicious, cluttered, or flawed code fragments is carried out by inspections. They use various modern static analysis methodologies: data flow analysis and pattern matching.
IntelliJ IDEA has a large number of inspections. To tell the truth, many inspections don’t exactly report an error. They rather point out carelessness in code or a possibility to change it with a neat alternative. After studying “Inspections → Java” a little, I noticed one thing. The inspections from the probable bugs, numeric issues, and serialization issues categories are more likely to find real bugs. Anyway, you should run through the inspections yourself and determine which ones would be useful for your project.
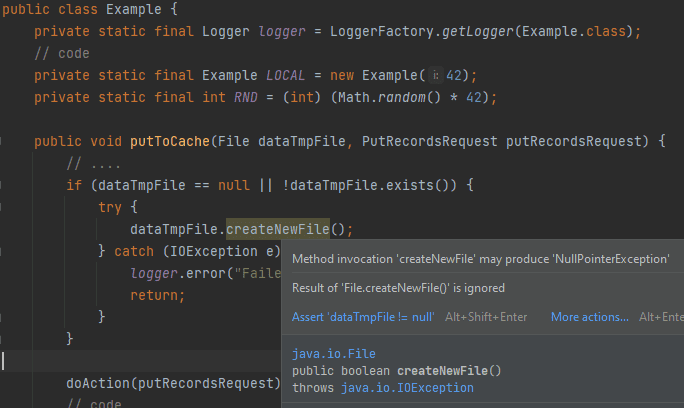
Since static analysis constantly runs in code editing mode, in IntelliJ IDEA you can fix mistakes seconds after you made them. The editor highlights the flawed code fragment.
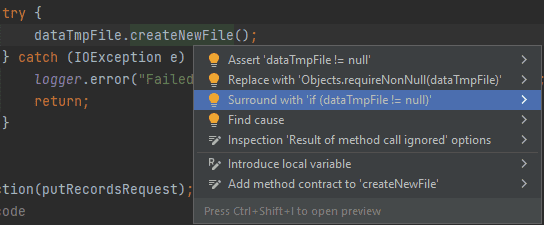
It’s really convenient and cool! Besides, if you use the “Alt + Enter” combination on the highlighted code fragment, you can choose one of the options to fix it in the context menu:
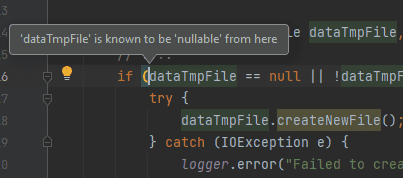
In addition, you can find out the reason why a particular inspection was triggered. In some cases it reduces the search time:
You can also run the analysis manually via “Analyze → Inspect Code.” Or you can run an individual inspection via “Analyze → Run Inspection by Name.” Specify the analysis scope (for a project, module, or a single file) before that! When you run the analysis this way, some inspections that don’t work in edit mode due to complexity become available.
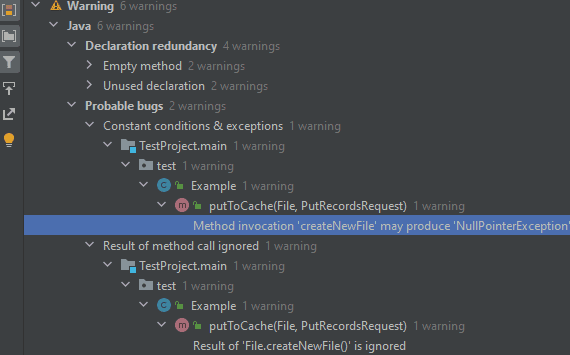
After the analysis, the results will be grouped by categories/directories in a separate window. From this window you can go to a specific inspection trigger:
IntelliJ allows you to save the analysis result only in HTML and XML formats. Unfortunately, in my opinion, the most convenient way to work with the detected problems is in IDE itself.
Note: Most of the static analyzer features are available in the free version of IntelliJ IDEA Community Edition.
SonarJava SonarJava is a static code analyzer for Java from SonarSource, which positions this tool as the best among others.
To build an AST model filled with semantic information, SonarJava accepts the file’s source code as input. If code uses external dependencies (and they usually always exist), it is also necessary to pass the dependencies bytecode for a complete model construction. But you shouldn’t worry about it if you integrate the analyzer in a build system (like Gradle, Maven, etc.) since it will do everything for you. Then modern static analysis methodologies are applied to the already-built model. The methodologies like data flow analysis, symbolic execution, and pattern matching help detect errors, code smells, and vulnerabilities.
Features:
- 150+ error detection rules;
- 350+ rules for detecting code smells;
- 40+ rules for detecting potential vulnerabilities;
- Integration with Maven, Gradle, Ant, Eclipse, IntelliJ IDEA, VS Code;
- Ability to expand with custom diagnostic rules;
- SAST-specialized tool: most diagnostic rules are made according to CWE, CERT, OWASP. You can run the analysis both within various IDEs (via SonarLint plugin) and within SonarQube.
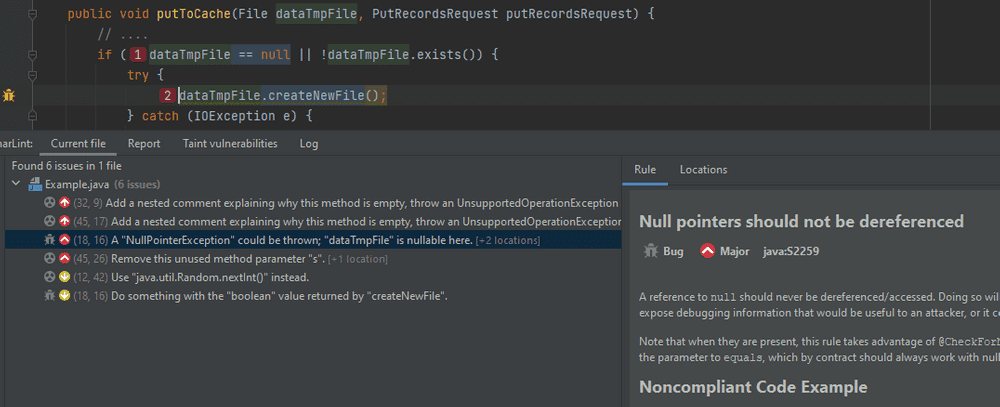
In IntelliJ IDEA, SonarLint detects suspicious/flawed code in the editing mode and can manually run on all files — just like a built-in code analyzer. SonarLint works side by side with IntelliJ IDEA’s built-in code analyzer. If you hover the cursor on the highlighted code fragment, you can often see warnings from both analyzers:
Of course, you can view the warning in a separate window:
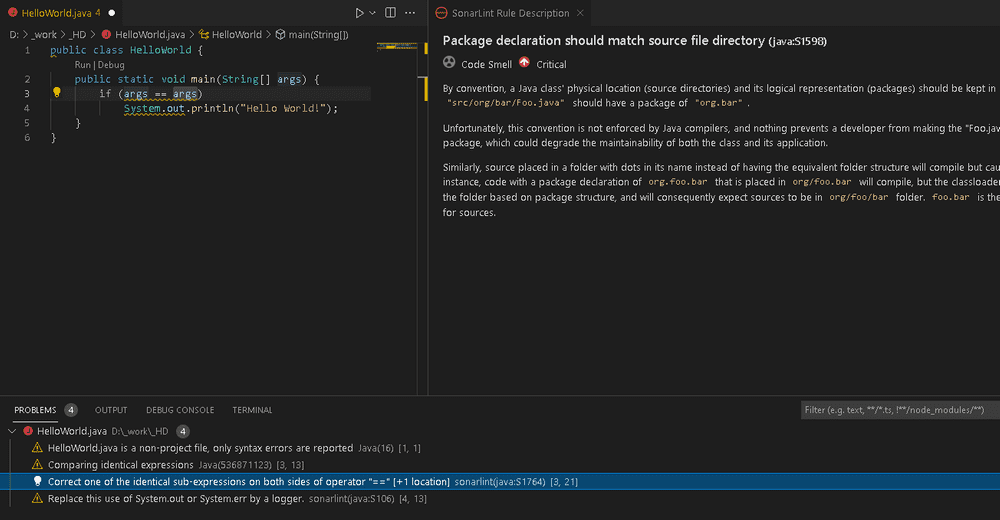
For example, in VS Code, the plugin results report looks like this:
In general, the ability to run SonarJava in different ways makes it appealing. It gives developers the freedom to choose a tool when writing code.
Most of the analyzer’s triggers are warnings of the “code smells” category, which only signal about flawed code. You will ignore most of these warnings, and I don’t recommend that you do it. My advice: before the analysis, run through the list and keep only the warnings related to your project.
Note: I don’t review the SonarQube platform in this article. But if you’re serious about code quality, you can consider using it. It allows you to accumulate reports of third-party analyzers in one place. Also, it provides a convenient web interface for continuous code quality control with various additional features. Importantly, there’s a free version of SonarQube Community.
FindBugs/SpotBugs
Unfortunately, FindBugs is long gone, as the last stable release was shipped in 2015. But we still take it into account, as it’s, perhaps, the most famous free Java static analyzer. If you ask a Java developer about static analysis, they will probably remember FindBugs first. Apart from other analyzers, this tool analyses bytecode instead of source code.
Open-source analyzer SpotBugs picked up where FindBugs left off. All the FindBugs advantages and disadvantages have most likely flowed into the successor. However, time will tell whether it’s good or bad. In the meantime, the analyzer community actively develops it. As proof:
- 400+ error detection rules;
- Integration in Ant, Maven, Gradle, Eclipse, IntelliJ IDEA;
- The ability to expand with custom diagnostic rules.
All the same methodologies are used to search for suspicious code: pattern matching and data flow analysis. The analyzer detects various error types that are related to multithreading, performance, vulnerabilities, code obfuscation, and so on.
In IntelliJ IDEA, the warnings window looks like this:
The warnings can be grouped by categories, classes, directories, and certainty level. You can view the warnings and the documentation for any diagnostic rule at the same time.
You launch the analysis manually. After the analysis, all the problematic code fragments are highlighted along with other warnings from IntelliJ IDEA and SonarLint. However, there’s a problem. You must restart the analysis in order to update the warnings according to the file changes you made. There are also many recommendation warnings, so you must configure the analyzer before active use.
Note: I ran through all three analyzers’ warnings and found out that they have a huge overlap in warnings.
PVS-Studio
PVS-Studio is based on the Spoon open-source library. It receives source code as input and builds a well-designed AST model with semantic information. Based on this model, the analyzer uses such modern methodologies as:
- Data-flow analysis;
- Symbolic execution;
- Method annotations;
- Pattern-based analysis. At the moment, the analyzer operates with more than 105 diagnostic rules that detect various code flaws. They include typos, dereference of a null reference, unreachable code, array index out of bounds, violation of the method use contract, etc. You can find out all the possibilities of diagnostic rules here.
Features:
- The analyzer focuses on finding real errors;
- Besides the CLI version, there is also integration into IntelliJ IDEA, Maven, Gradle, Jenkins, SonarQube;
- The ability to run the analyzer in incremental mode;
- The analyzer identifies potential compatibility problems with Java SE API when migrating the project from Java 8 to more recent versions;
- PVS-Studio converts a report into various user-friendly formats: JSON, XML, HTML, TXT;
- SAST-specialized tool: most diagnostic rules are made according to CWE, CERT, OWASP. As usual, I will delve into using the analyzer in IntelliJ IDEA.
Unfortunately, you can only start code analysis as a separate step. You can run the analysis either manually or automatically after building the project. However, it performs a deeper analysis, which is not limited by time or consumed memory. This allows you to detect more complex errors.
All the analyzer warnings are brought together in a special table. Here you can conveniently work with them (sort, filter, mark as False Alarm):
Note 1: PVS-Studio is a proprietary software, but you can also use it for free.
Note 2: Its competitive advantage is fast and high-quality support directly from the analyzer developers.
PMD PMD is an open-source static analyzer. It detects common development mistakes: unused variables, empty blocks, creating unnecessary objects, and so on.
The analyzer uses the source code as input. At this moment PMD analyzes one source file at a time, which imposes restrictions on the analysis’s completeness. So, if you look at the roadmap, you can see the intention to get more inter-class information, which allows the developers to implement more diagnostic rules.
Despite the fact that it analyzes the source code, the PMD authors advise building the project before the analysis. This allows extracting information about the types used in the code analyzed.
Features:
- Integrates into various IDEs (IntelliJ IDEA, Eclipse, NetBeans, etc.) and assembly systems (Maven, Gradle, Ant);
- Supports a variety of analyzer report formats: SARIF, CSV, IDEA, JSON, text (default), XML, HTML, TextColor, and so on;
- Has 300+ diagnostic rules patterns. Categories: coding style, best practices, bugs, multithreading, performance, and so on;
- Supplies CPD (copy-paste-detector) along with PMD, which detects the duplicates in code. If we look at all the diagnostic rules, then PMD is more focused on solving coding style problems and detecting obvious errors. The diagnostic rules may contradict each other, so you need to configure them before using the analyzer.
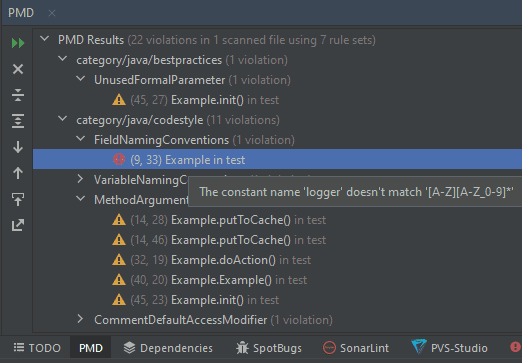
You can also run the analysis through a plugin for IntelliJ IDEA, but you can’t select individual files for the analysis. The warning window looks like this:
To my mind, it is not very convenient to work with warnings, as it is impossible to group them by files and non-obvious messages. They only appear if you hover the cursor over the warning.
Summing Up the Results
Of course, there are other analyzers, apart from the reviewed ones. There are both paid (Coverity, Klockwork, JArchitect, etc.) and free (Error Prone, Infer, Checkstyle, and so on). All of them are focused on one thing: to prevent flawed or potentially erroneous code from getting into production. I have no right to judge which of the analyzers is better for this task. But the analyzers developing data flow analysis and symbolic execution are more likely to find a real code bug.
If you’re choosing a static analyzer, pay attention to:
- an integration in various IDEs;
- an integration in build systems;
- the convenience of running the analyzer on a server;
- the ability to detect errors in code editing mode;
- the ability to conveniently work with warnings;
- orientation on SAST;
- the percentage of false positives;
- the configuration complexity.
The combination of all pros and cons will lead you to the number of static analyzers that you will consider the best.
Note: I gave examples of integration with IntelliJ IDEA, as I often use it. Therefore, for me, integration with this IDE was a priority during the review.
Conclusion
We have reviewed the tools that quickly detect the erroneous code fragments before they get into production. Up to this moment, a number of tools are available. Each of them has its own advantages and disadvantages. With this in mind, don’t stop at only one analyzer. Use several analyzers that complement each other — they can create a strong barrier that protects your code from bugs and vulnerabilities. Therefore, the choice is yours!
